Common Core Content Activity: Creating Displays
Creating Displays: Students learn about bar graphs, pictographs, line plots, and pie charts. They have to look at a graph and determine the correct data table. After familiarizing themselves with the graphs, they have to graph and interpret the data.
Extras – bulletin board pictures and definitions, vocabulary word cards
Bonus: The introduction/Lesson 2 includes a PowerPoint.
Lesson & Activities Creating Displays
Lesson 1 and 8 – Pretest/Posttest
Lesson 2 – Introduction
Lesson 3 – Bar Graphs
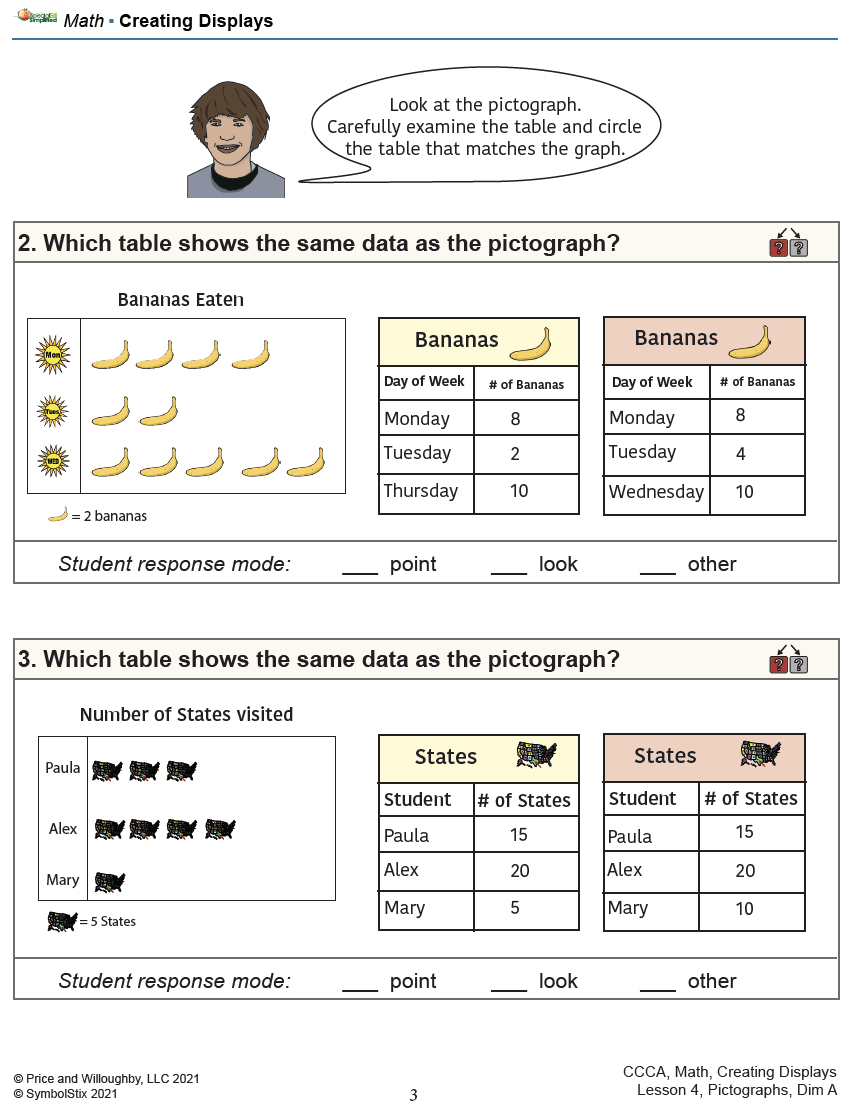
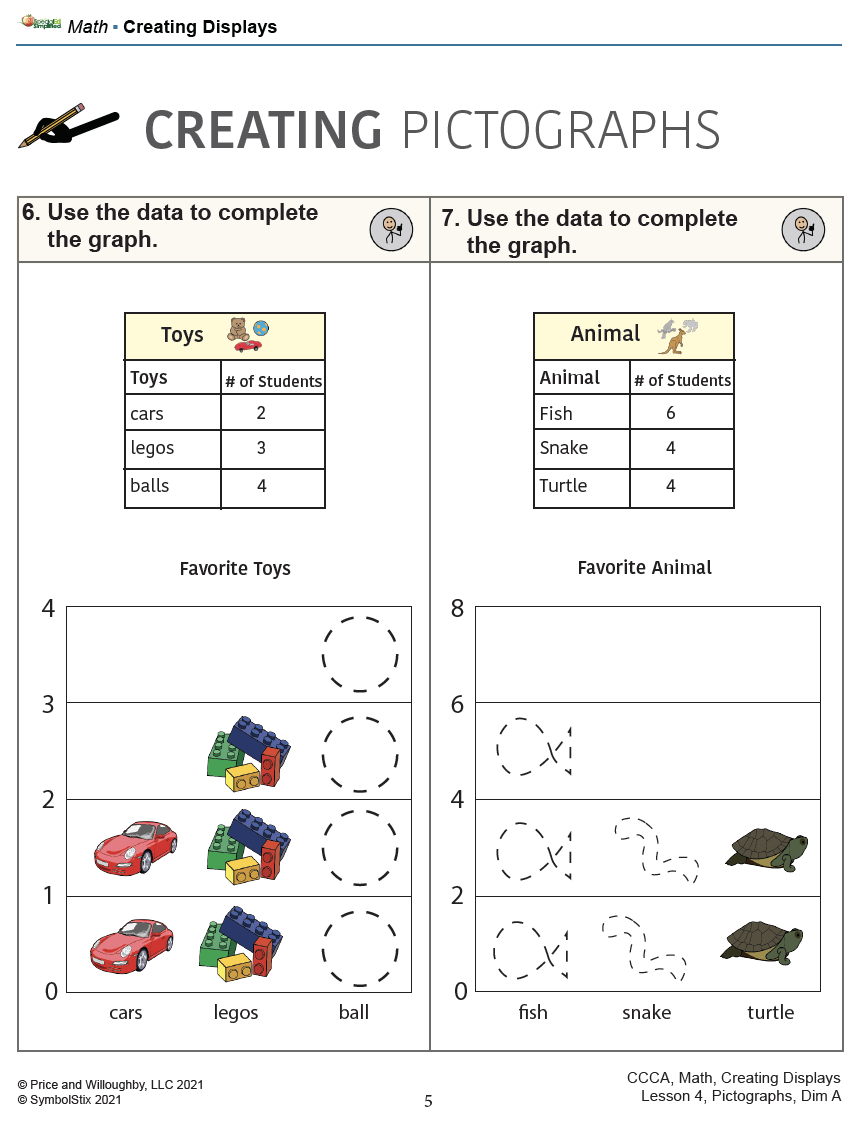
Lesson 4 – Pictographs
Lesson 5 – Line Plots
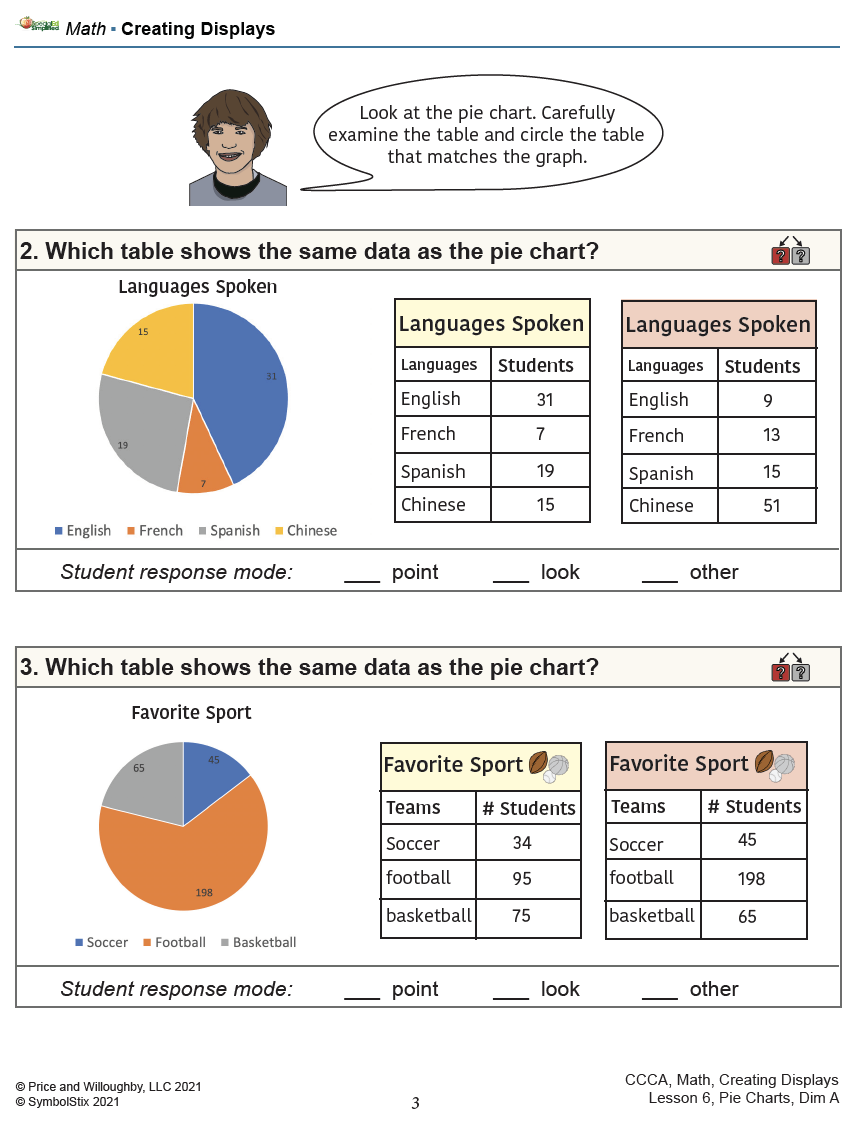
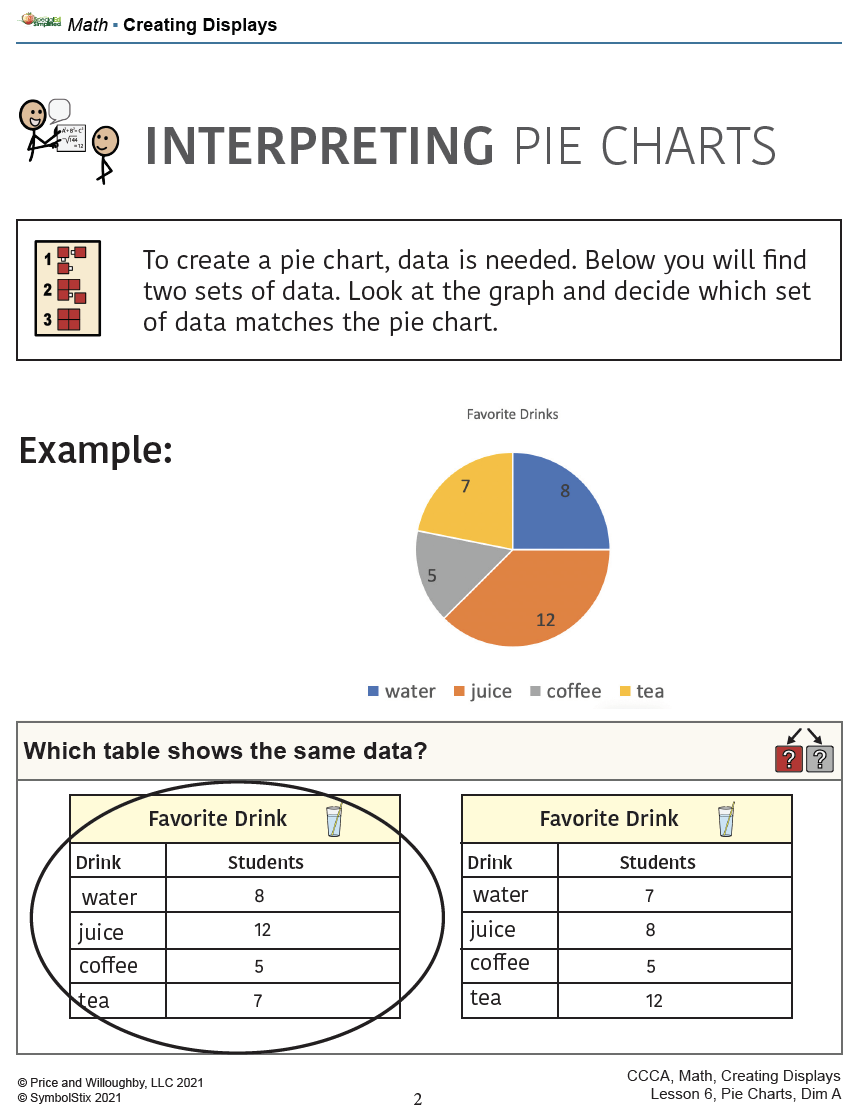
Lesson 6 – Pie Chart
Lesson 7 – Review
THIS IS A SINGLE-USE LICENSE. ITEMS ARE NOT TO BE REDISTRIBUTED.
ONLY THE BUYER MAY USE THESE MATERIALS.
Activities are self-explanatory and do not include lesson plans.
THESE ACTIVITIES ARE ONLY BASED ON COMMON CORE STANDARDS. PRICE AND WILLOUGHBY, LLC EXPRESS NO GUARANTEE ON TEST SCORES.


Reviews
There are no reviews yet.